10 key metrics in delivery logistics you should be tracking (2025 updated)
If it can’t be measured, it can’t be improved – said Peter Drucker. Oftentimes, it is difficult to determine the key metrics of success for the delivery logistics. Each business is different. The only way to ensure all goes to plan is to use key performance indicators (KPIs). Evaluate different parts of your service and see the performance.
Numbers rarely lie, but they tell a great story.
Last-mile delivery KPIs are like a birds-eye view of your business: its success, its efficiency rate can tell you the hard truth about your delivery operations.
There are multiple ways to measure your achievements, either through a powerful digital delivery planner or manually, in a spreadsheet. Track the key metrics in your logistics business and see how accurately your drivers pick up or drop off the orders. Another important view is how effectively you’re using your resources.
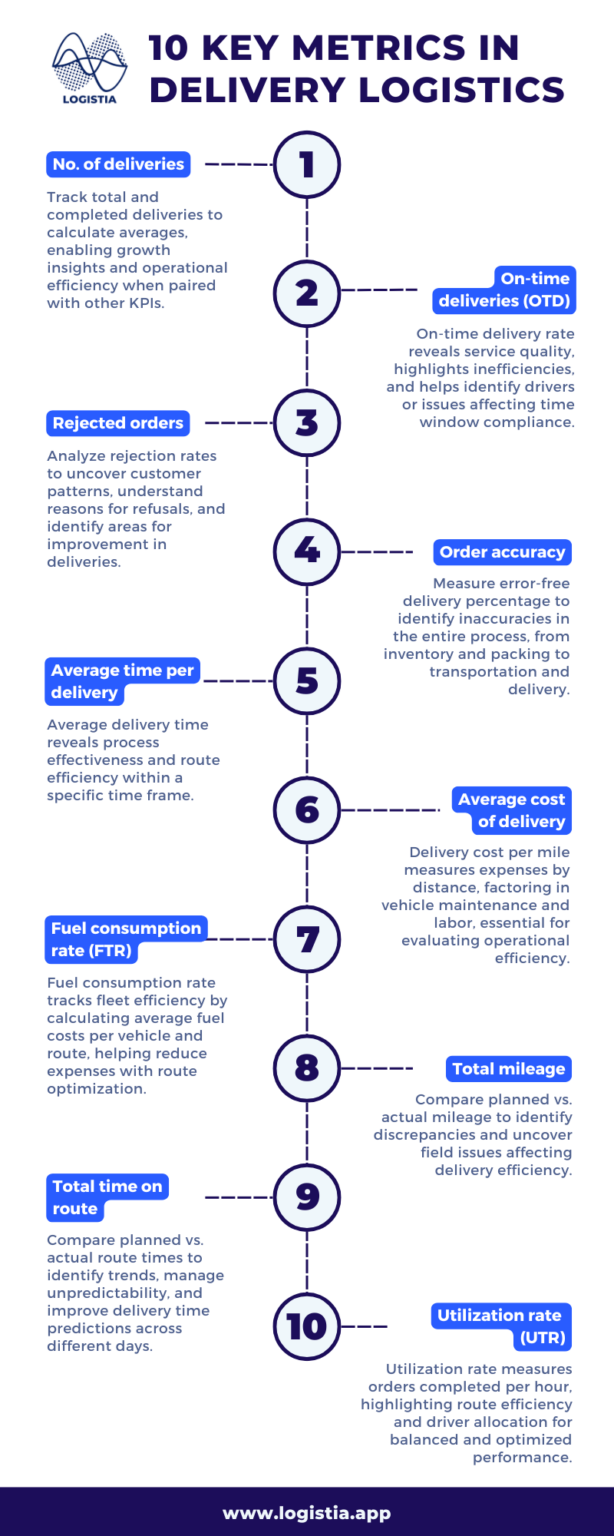
KPIs let you take actionable steps in improving your delivery operations. Here are 10 key logistics metrics that can help you:
1. Number of deliveries
This is the total number of orders the drivers leave your main location with. You can track this number weekly or monthly, depending on how frequently you make your deliveries. Even if this is an obvious metric, you are going to base all your other KPIs on this one.
Analysts will also use the number of completed (successful) deliveries for this KPI. Based on either metric, you can calculate the average number of deliveries. This will give you a better understanding of potential growth, especially when you put it aside other KPIs, such as time on route or others to show the operational capacity and effectiveness.
2. On-time deliveries (OTD)
The number or percentage of deliveries that were carried out on time, as requested by the customer. This number shows a quick answer to whether you offer a quality delivery service or not. There are drivers that idle too long in their car between stops, don’t pay attention and miss the address, or are unorganized with their packages in the car. As a result, they spent far longer time at each stop.
Use this metric to identify the outliers and why the time window was not respected. It gives you the opportunity to better understand what’s happening on the field, and how you can improve.
3. Rejected orders
You can analyze this metric as a number or percentage. You might want to dig deeper and determine why certain orders get rejected by recipients. Uncover patterns in customer reasons and see what can be improved.
4. Order accuracy
The percentage of orders done error-free, compared with the total number of orders delivered. This KPI helps you identify any inaccuracies in the delivery process, from warehouse to picking, packing, and delivery.
An error order can occur at any time during the process. It’s essential to measure it frequently across the entire delivery process: inventory, procurement, invoicing, depot planning, and transportation.
5. Average time per delivery
This is the average time it takes to complete one delivery in a specific period of time. It offers insight into the effectiveness of the delivery process, as well as the efficiency of the planned delivery routes.
6. Average cost of delivery
This is one of the most important KPIs you should track in your delivery business. It’s usually based on distance (miles or kilometers), type of delivery, or type of vehicle. To calculate this metric, you’ll need the cost of vehicle maintenance and the cost of labor.
7. Fuel consumption rate (FTR)
The cost of fuel is a major expense for any business, and it is especially costly for last-mile logistics. The fuel consumption rate shows you how much your fleet saves or wastes in a time period. All you have to do is compute the average fuel prices per vehicle, per route.
The best way to reduce FTR is to use a route planner and monitor the fleet throughout the operational time.
8. Total mileage
Every time an order is dispatched, a plan concerning its expected last-mile mileage is made. The actual mileage of the order may not be the same as the planned one. By drawing the comparison between the planned and actual route mileage, you can easily find out whether there are any problems on the field.
9. Total time on route
Traffic is unpredictable, which adds to the stress of doing last-mile delivery. A route planner can offer you the total planned time on the route which you can compare to the total actual time on the route. Comparing multiple days or even weekdays against each other, you can predict with much more accuracy the daily behavior.
10. Utilization rate (UTR)
Taking all the orders and dividing them by a certain period (usually an hour) gives you the utilization rate, or how many orders a driver can visit in that designed period. It’s best to correlate them with their closeness on the map and the distance between all the stops, to see whether the drivers have an equal UTR and how you can improve their allocation.
11. (Bonus) Customer satisfaction rate
Lastly, customers are the ultimate success factor. Their opinions matter and you should listen carefully to what they have to say. Measure their overall satisfaction and offer them the ability to leave an honest review about their experience. It’s an invaluable step in improving your delivery operations and gaining more customers from referrals.
Besides improving the last-mile delivery performance, key performance indicators have a crucial role in attracting new customers and retaining loyal ones. Logistia Route Planner is a smart platform that offers a strong delivery logistics management solution. Would you like to check it out? Let’s get in touch here.